ImpactBoard helps results-driven organisations manage data, track indicators, monitor activities and beneficiaries, and turn evidence into dashboards, from frontline implementation to executive oversight.
See ImpactBoard in action and get answers to your questions.
Programme progressLive
1,284Beneficiaries reached
Sessions completed vs target
Products
Choose the ImpactBoard edition that fits your work
ImpactBoard is a secure, configurable data management and reporting platform that helps organisations track strategy, performance and impact: from objectives and key results to programme outcomes, partner reporting and executive dashboards. It is offered in two editions: Nexus for social impact ecosystems, and Pulse for white-label performance and partner reporting platforms.
ImpactBoard Nexus
Nexus.
For social impact, M&E and programme reporting
ImpactBoard Nexus helps funders, NGOs, NPOs, foundations, evaluators and government partners implement monitoring and evaluation (M&E) frameworks, collect field data, track beneficiaries and activities, and report on outputs, outcomes and impact. Nexus is designed for multi-partner programmes where funders, implementers and programme teams need a shared, trusted view of progress.
As a multi-tenant platform, Nexus connects the whole ecosystem through shared data assets: a maintained institution hierarchy, verified masterlists, and ecosystem views across funders, implementers and programmes.
White-label platforms for organisations and ecosystems
ImpactBoard Pulse gives organisations a secure, configurable version of ImpactBoard under their own brand, domain and partner ecosystem. Launch a branded OKR tracking platform, reporting portal, supplier development platform, SME readiness platform, grantee reporting system or partner data hub, powered by ImpactBoard and configured to your logo, colours, workflows and reporting rules.
Pulse is ideal for organisations that need a secure white-label reporting platform for internal teams, partners, suppliers, grantees, SMEs or ecosystem stakeholders.
M&E system for programmes, beneficiaries and outcomes
Nexus or Pulse
Funder or partner reporting platform
ImpactBoard Pulse
Branded platform under your own domain · OKR or KPI tracking platform · Supplier, SME, grantee or partner reporting portal
• Need custom workflows, integrations or enterprise governance? ImpactBoard Pulse EnterpriseSee pricing →
The Power of Data Visualisation
When data is visible, it's actionable.
Data visualisation turns numbers into meaning, revealing patterns, trends, and insights you can't spot in a spreadsheet. It helps you communicate clearly, make better decisions faster, and rally teams around the same goals.
Current ImpactBoard Uses
One platform, many ways to work
Custom Dashboards
Visualise and share your progress with confidence. Use our dashboard builder or request bespoke dashboards to help your team or stakeholders understand the story behind your data.
Objectives and Key Results
Track your strategy with SMART goals. Track consistent indicators for your strategic objectives and seamlessly consolidate data from existing systems and sources.
Monitoring & Evaluation Frameworks
Structure your programme logic and track your results. Report against customised results frameworks using indicators aligned to your theory of change. Monitor progress across multiple sites or partners, and report results to donors, boards, or internal stakeholders.
Programme Reporting
Consolidate results across multiple departments and geographies. Gain a comprehensive line of sight into your progress at various levels, whether your teams span different departments, geographies, or focus areas.
Partner Reporting
Aggregate and compare across multiple implementers. View consistent reporting from grantees and implementing partners, and easily consolidate progress at a programme or portfolio level.
Activity Attendance Tracking
Track who attends and how often. Whether it's a community workshop, teacher training session, or mentoring session, capture attendance in real-time or offline and link it to your reporting dashboards.
Beneficiary Tracking
See individual progress over time. Track people across programmes to understand what support was provided, how often, and what outcomes were achieved, ideal for evaluations or longitudinal reporting.
Data Collection & Surveys
Digitise routine or once-off data collection. Use standardised or custom forms to collect field-level data, whether it's baseline, endline, or post-implementation surveys. Works both online and offline.
Selected Clients
Trusted by
Department of Basic Education
Department of Social Development
DGMT
Vangasali
CASME
CAPSI
Ubuntu Pathways
Security & Governance
Built with privacy, security and governance in mind
ImpactBoard is designed to help organisations manage sensitive programme, beneficiary, partner and performance data responsibly. ImpactBoard is hosted on AWS and uses secure cloud infrastructure, with data stored in South Africa and encrypted in transit and at rest.
Role-based user access and configurable permissions
Audit trails for key platform activity
Data retention and governance settings
Designed to support POPIA-aligned data management practices
Designed in South Africa for frontline and boardroom end users
Optimised for structured data storytelling on progress and impact
Empowers self-service data management and analytics
Easy to use, even for non-technical users
Scales with your needs as you grow
The Data Innovators Approach
Software with a partner behind it.
ImpactBoard is built and implemented by Data Innovators, an African innovation and data partner. Every implementation is guided by our focus on value creation, customer success and benefits realisation, so your platform delivers measurable results, not just features.
Value creation
We design each implementation around the outcomes and decisions your data must support.
Customer success
Setup, training, change management and support keep your team confident and self-sufficient.
Benefits realisation
We track adoption and evidence the value delivered, from rollout through to scale.
Ready to explore what's possible?
Unlock the full potential of your data, drive operational efficiency and fuel innovation. Speak to execution and results with confidence.
Visualise trends, track progress, and make data-driven decisions with intuitive, real-time dashboards.
Unlock value with data
Transform raw data into actionable insights that drive smarter decisions, boost performance, and help your teams achieve measurable impact faster.
Spot what's holding you back
Visualise trends, drill down into your data, and quickly identify process bottlenecks or underperforming areas so you can act before they slow you down.
Bring your impact into focus
Enhance visibility across projects, teams, and indicators, keeping everyone from frontline staff to leadership aligned, informed, and ready to respond.
What you see
How it is organised
Visualise trends and progress in real time
Custom dashboards
Share visual summaries with stakeholders such as boards, donors and team leads, tailored to your reporting needs.
Flexible reporting
Combine data from different sources to create intelligent and downloadable dashboards.
Interactive analytics
Filter, zoom in and drill through the charts to explore the data and gain deeper insights.
Enriched data
Add text to your dashboards and annotate your charts with events to tell your data story.
Enhanced collaboration
Share your ImpactBoard dashboards with others and see all your dashboards in one central place, even from other BI tools.
Connections
Governed ImpactBoard data can feed the BI tools your analysts and funders already use.
Microsoft Power BI
Tableau
Google Data Studio
Dashboards you can build
From boardroom strategy to field operations: examples of dashboards teams build with ImpactBoard:
Strategy & OKR dashboards
Track objectives and key results against targets, from company level down to teams.
M&E results dashboards
Report outputs, outcomes and impact against your results framework or theory of change.
Attendance & dosage dashboards
See who attended, how often, and whether participants received the intended dosage.
Funder & portfolio dashboards
Compare progress across grantees, sites or programmes in a single view.
CSI, ESG & B-BBEE dashboards
Evidence your social investment and transformation spend for boards and verification.
Data quality dashboards
Monitor completeness, timeliness and validation status across submissions.
Indicator Reporting
Measure what matters
Track and report on key indicators to demonstrate outcomes and drive continuous improvement.
Improve performance
Track key indicators in real time to spot trends, take timely action, and boost performance.
Focus on what matters most
Filter out the noise and concentrate your efforts on the metrics that directly advance your mission.
Align teams & strategy
Keep teams and stakeholders on the same page with shared, up-to-date reporting that reflects your goals.
What you capture
What you see
Track indicators in real time
Standardised indicators
Use a consistent set of indicators and disaggregations across teams and organisations to make data easier to compare and analyse.
Logical frameworks
Easily assess whether you are on track to achieve your ultimate goals by associating indicators with and linking objectives in a logical structure.
Target setting
Set targets for the relevant period and automatically determine progress status.
Flexible tracking
Assign tracking of indicators to specific users who can manually enter or calculate indicators from datasets.
Bulk data upload
Bring in historical data or upload spreadsheets to save time on manual entry.
Beneficiary Management
Know who you serve
Easily capture, update, and manage detailed beneficiary data in one secure place.
Maximise your impact
Gain a clear, comprehensive view of who you serve so you can target interventions where they matter most.
Track beneficiaries seamlessly
Maintain detailed, centralised records to follow each beneficiary's journey without duplication or gaps.
Improve data accuracy
Capture, validate, and update beneficiary information easily to keep your data clean and reliable.
What you capture
What you see
Beneficiary data in one secure place
Unique beneficiary ID
Understand the journey of individuals across your programmes: who's involved, what support they've received, and how outcomes evolve.
Related beneficiaries
Link beneficiaries that are related to each other (e.g., learners and caregivers) and create households for better planning and reporting.
Linked entities
Associate beneficiaries with unique institutions, organisations and communities for efficient group tracking and reporting.
Seamless tracking
Capture beneficiary data once and use it multiple times to track services used and dosage accurately.
Bulk data upload
Bring in historical data or upload spreadsheets to save time on manual entry.
Case Management
Track every case, every step
Monitor individual cases, manage interventions, and follow progress from start to finish.
Achieve better results
Manage every case proactively with timely updates, built-in workflows, and real-time insights.
Ensure service continuity
Keep case histories, notes, and actions in one place so teams can step in without missing a beat.
Boost team productivity
Streamline administrative work so your team spends less time chasing information and more time supporting people.
What you capture
What you see
Monitor individual cases from start to finish
Unique case ID
Understand the journey of individuals across your programmes: who's involved, what support they've received, and how outcomes evolve.
Associated cases
View associated cases to plan support efficiently and monitor cross-cutting needs and knock-on effects.
Case history
Easily access previous sessions and notes to continue from where you left off.
Track services
Track services delivered during each session to monitor support and measure in a granular manner.
Role-based access
Restrict case access to authorised users to uphold confidentiality.
Attendance Tracking
Never miss a session
Capture attendance quickly and accurately to improve participation insights and reporting.
Improve participation
Monitor attendance in real time to encourage engagement and reduce drop-off rates.
Spot at-risk participants early
Identify patterns of absence so you can intervene before learners or clients disengage completely.
Maintain dosage fidelity
Ensure participants receive the full intended service or curriculum by accurately tracking every session.
What you capture
What you see
Capture attendance in real time
Real-time attendance registers
Monitor sessions and track participation instantly, giving you a live view of implementation.
Headcount tracking
Capture attendance of crowds or unknown participants using the headcount option.
Flexible views
Manage the attendance of frequent sessions using the weekly view for ease of tracking.
Track guests and substitutes
Monitor the participation of guests and substitutes with your core participants without affecting their attendance rates.
Insightful reporting
Query data by participants, sessions and activities to provide deeper insights on involvement, dosage and patterns.
Forms
Collect the data you need
Design and deploy custom digital forms to gather consistent, high-quality data from the field.
Hear every voice
Design surveys and feedback forms to capture stakeholder and participant perspectives directly.
Assess participants easily
Collect structured assessment data to measure knowledge, skills, or progress consistently.
Streamline data collection
Replace paper processes with digital forms that feed data instantly into your dashboards and reports.
What you capture
What you see
Custom forms for online and offline data needs
Advanced custom forms
Use a drag-and-drop form builder to add any of 20+ built-in question types, including GPS coordinates, to meet your data collection needs.
Input validation
Enhance data accuracy by controlling and validating user input. Use a street address or map to select GPS coordinates or determine them using device location.
Question logic and branching
Add logic to your form to show relevant questions and determine answers for questions from previous responses. Use the JSON editor to code your form efficiently.
Datasets
Use datasets to dynamically provide choices and default values for questions, and push submitted data to datasets.
Offline data collection
Gather data even when you're offline. Field teams can sync information later when back online.
Data Assets & Utilities
Clean data, ready for analysis
Keep your data clean and analysis-ready with trusted reference datasets and built-in data cleaning utilities.
Analyse programmes in context
Enrich your analysis with cleaned reference datasets, from municipalities and districts to institution masterlists, ready to link to your programme data.
Trust every record
Validate data as it is captured, so dashboards and reports are built on reliable information.
Save hours of cleaning
Standardise formats automatically instead of fixing spreadsheets by hand.
What you upload
What you see
Clean, validate and enrich your data
Cleaned reference datasets
Access analysis-ready datasets for South African municipalities, districts and institution masterlists to contextualise your programme analysis.
Institution hierarchy
Link your data to a maintained hierarchy of provinces, districts, municipalities and institutions for consistent roll-up reporting.
SA ID number validation
Validate South African ID numbers automatically, flag invalid entries, and derive date of birth and gender for clean beneficiary records.
Standard formatting
Apply consistent formatting to names, dates, contact numbers and locations across your datasets.
Deduplication
Detect and merge duplicate records to keep beneficiary and institution masterlists accurate.
Get the full feature overview
Every module, the security posture and the reporting outputs, in one shareable PDF.
ImpactBoard supports a range of teams and projects. From tracking early childhood development programmes to monitoring supplier development initiatives, we offer the flexibility to meet real-world reporting needs.
Track OKRs, KPIs and performance in one secure platform.
ImpactBoard Pulse helps organisations turn strategy, operations and partner reporting into clear, measurable dashboards. Track objectives, key results, KPIs, initiatives and performance data across teams, departments or partner networks, with a configurable platform that can be deployed under your own brand.
Business performance is often managed through scattered spreadsheets, static reports and dashboards that do not connect clearly to strategic goals. ImpactBoard Pulse helps teams create a shared view of performance, so leaders can see what is on track, what needs attention and where decisions are required.
Use Pulse to track strategic objectives, operational indicators, partner performance, reporting workflows and board-level dashboards, without forcing your organisation into a rigid off-the-shelf model.
Who Pulse is for
Built for organisations that need clearer performance visibility.
ImpactBoard Pulse is designed for teams that need to manage performance, reporting and accountability across multiple users, business units or partner organisations.
OKR and KPI tracking
Set objectives, define measurable key results, assign owners and track progress through dashboards that connect strategy to delivery.
Bring data together from teams, spreadsheets or existing systems to monitor progress, identify bottlenecks and support management decisions.
Partner reporting portals
Collect structured data from partners, branches, entities or delivery networks and consolidate it into a shared performance view.
Board and executive dashboards
Turn strategic priorities, indicators and implementation updates into clear dashboards for executive teams, boards and steering committees.
White-label reporting platforms
Deploy Pulse under your own name, logo, colours and domain for internal users, clients, partners or ecosystem stakeholders.
CSI & ESG reporting
Report corporate social investment and ESG performance with credible, auditable data.
Enterprise & Supplier Development
Track ESD programme spend, beneficiaries and outcomes for reporting and verification.
B-BBEE reporting
Consolidate evidence for the skills development, ESD and SED elements of your scorecard.
A practical platform for performance, reporting and accountability.
With ImpactBoard Pulse, your organisation can
Track objectives, key results, KPIs and initiatives.
Assign ownership and reporting responsibilities.
Consolidate data from multiple teams, partners or sources.
Create dashboards for different roles and levels of decision-making.
Monitor data quality, submission status and reporting completeness.
Use forms and structured submissions to replace manual reporting processes.
Deploy a branded platform under your own domain.
Support privacy, access control and data governance requirements.
How Pulse works
Configurable around your organisation.
Pulse is not a one-size-fits-all dashboard. It is configured around your goals, users, reporting model and data sources.
Define what needs to be tracked
We work with you to clarify your objectives, indicators, reporting structure and decision needs.
Configure the platform
Pulse is configured around your teams, users, roles, data fields, workflows, dashboards and reporting rules.
Bring your data together
Data can be captured through forms, uploaded from spreadsheets or connected from existing systems where appropriate.
Visualise progress
Dashboards help users monitor performance, identify gaps and communicate progress clearly.
Improve over time
As your reporting needs mature, Pulse can scale with additional dashboards, workflows, integrations, data assets and governance requirements.
White-label deployment
Your platform. Your brand. Powered by ImpactBoard.
ImpactBoard Pulse can be deployed as a white-label platform under your own brand and domain. This is useful when you need a branded reporting environment for internal teams, partners, clients or ecosystem stakeholders.
Everything you need to manage performance data more clearly.
Dashboards
Visualise strategy, performance and reporting progress through role-based dashboards.
Indicator reporting
Track KPIs, key results and performance indicators against targets.
Forms and submissions
Collect structured updates from teams, partners or business units.
Data uploads
Bring in spreadsheet-based data and historical reporting records.
Data quality views
Monitor completeness, timeliness and validation status across submissions.
Role-based access
Give different users the right level of access to data, dashboards and workflows.
White-label configuration
Deploy the platform under your own brand, domain and reporting model.
Security and governance
Designed with privacy, governance and security in mind.
ImpactBoard Pulse is designed for organisations that need to manage performance and reporting data responsibly.
ImpactBoard is hosted on AWS. Data is stored in South Africa. Where approved international services are used, data is encrypted in transit and at rest. Pulse can be configured with role-based access, user permissions, audit trails and data governance settings to support responsible data management.
We design implementations with privacy, regulatory requirements and governance in mind, including POPIA-aligned data management practices.
Pulse is useful where organisations need more than a dashboard. It supports structured reporting across multiple teams, partners or entities, while giving decision-makers a clear view of progress and performance.
Examples include
Internal OKR and KPI tracking.
Executive performance reporting.
Partner reporting portals.
Branded programme reporting platforms.
Multi-entity performance dashboards.
Client or ecosystem reporting environments.
Connections
Report where your teams already work.
Dashboards live in ImpactBoard, and the same governed data can feed the business intelligence tools your analysts and stakeholders already use.
Microsoft Power BI
Tableau
Google Data Studio
Ready to make performance visible?
Whether you are tracking OKRs, consolidating partner reporting or launching a branded platform, ImpactBoard Pulse can help you turn fragmented data into clearer decisions.
Monitor programmes, beneficiaries and impact across your ecosystem.
ImpactBoard Nexus helps funders, government institutions, NGOs, implementers and evaluators manage monitoring and evaluation frameworks, collect field data, track beneficiaries and activities, and report on outputs, outcomes and impact.
Nexus is designed for multi-partner and multi-level programmes where frontline users, organisations, districts, provinces, funders and national teams need a shared, trusted view of progress.
A shared measurement layer for social impact work.
Social impact programmes often rely on fragmented spreadsheets, manual reporting and disconnected systems. This makes it difficult to understand what is happening, where support is needed and whether programmes are achieving their intended results.
ImpactBoard Nexus provides a configurable measurement layer that connects programme design, data collection, beneficiary tracking, partner reporting and dashboards. It helps teams move from scattered reporting to credible evidence and clearer decisions.
Who Nexus is for
Built for organisations working across programmes, places and partners.
ImpactBoard Nexus supports organisations that need to track implementation and results across multiple users, organisations, geographies and reporting levels.
Government programme monitoring
Track implementation across districts, provinces, facilities, institutions or delivery partners, while consolidating indicators into higher-level views.
Funders and grantmakers
Collect consistent reporting from grantees and implementing partners, and view portfolio-level dashboards across programmes.
NGOs and implementers
Manage activities, attendance, beneficiaries, services and outcomes against your results framework.
Evaluators and learning partners
Collect structured data for baselines, endlines, longitudinal tracking and programme learning.
Multi-partner social impact programmes
Create a shared reporting environment where each organisation can manage its own work while indicators consolidate across the full ecosystem.
Track the work, the people and the results.
With ImpactBoard Nexus, your organisation can
Configure theories of change, results frameworks and indicators.
Track activities, attendance, beneficiaries, cases and services.
Collect field-level data through online and offline forms.
Manage partner, grantee or implementing organisation reporting.
Link data to institutions, districts, provinces and other geographic structures.
Consolidate indicators across organisations and reporting levels.
View dashboards for frontline teams, programme managers, funders and executives.
Improve data quality through validation, standardisation and deduplication.
Support privacy, access control and responsible data governance.
How Nexus works
Designed for multi-level reporting.
Nexus is designed to support complex reporting structures without losing the frontline view.
Configure the programme logic
Set up your results framework, indicators, activities, beneficiaries, institutions, organisations and reporting levels.
Give each organisation the right view
Each participating government institution, NGO, funder, implementer or partner can access the data and dashboards relevant to its role.
Collect data close to implementation
Frontline users can capture activities, attendance, beneficiary records, case updates, assessments and surveys through structured forms.
Consolidate indicators across levels
Data can roll up from organisation to district, district to province, and province to national or portfolio-level dashboards.
Use evidence to manage and learn
Dashboards help users monitor delivery, identify gaps, understand performance and report progress to stakeholders.
Case study · ECD Registration Management Tool
ECD monitoring across South Africa.
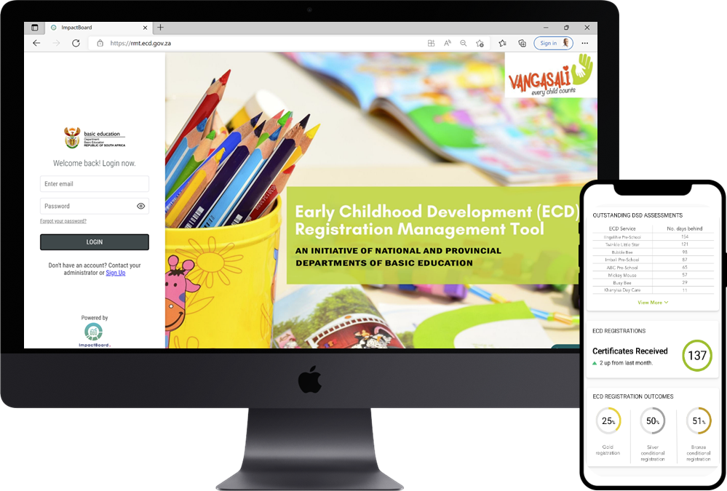
The ECD Registration Management Tool (RMT) is a web-based application powered by ImpactBoard that enables social services professionals to track and monitor the registration of early childhood development services across the country.
The RMT was developed with the Nelson Mandela Foundation and the Department of Social Development to track ECD registration, identify where support was needed and visualise progress at national, provincial and district level. It was configured in web and mobile formats to support registration data collection by roughly 20 000 ECD practitioners.
Each participating government institution and NGO accessed an organisational portal to track and monitor its own work. Indicators were consolidated from organisational level to district, provincial and national views, creating a shared picture of implementation progress across the ecosystem.
What the tool does
Maintains a live database of registered and unregistered ECD services for reference and updates.
Tracks each ECD service along every stage of the registration process.
Digitises the registration framework for service assessments and compliance determination.
Surfaces outstanding assessments, certificates received and registration outcomes on dashboards.
Rolls organisational data up to district, provincial and national views.
9Provinces covered
75Districts reporting
42 420ELPs migrated and tracked
2020Built for Vangasali Campaign
Core capabilities
Built around the realities of social impact delivery.
Monitoring and evaluation frameworks
Configure results frameworks, indicators, targets and reporting structures.
Beneficiary management
Capture, update and track beneficiary records in one secure place.
Activity and attendance tracking
Track sessions, services, attendance, dosage and participation patterns.
Case management
Manage individual cases, service histories, notes and follow-up actions.
Forms and surveys
Collect baseline, endline, assessment, feedback and implementation data online or offline.
Partner reporting
Enable NGOs, implementers, grantees or government partners to report through structured workflows.
Institution and geography hierarchies
Link data to institutions, communities, districts, provinces and national structures.
Dashboards and reporting
Create views for frontline teams, programme managers, funders, executives and oversight bodies.
Data quality tools
Support validation, standardisation, deduplication and analysis-ready datasets.
Why Nexus
More than dashboards. A connected impact data system.
Nexus is designed for organisations that need to manage implementation data, not only visualise it. It combines data collection, beneficiary tracking, indicator reporting, institutional hierarchies and dashboards in one configurable platform.
It is especially useful where
Multiple organisations contribute data.
Reporting needs to roll up across levels.
Beneficiaries, institutions or sites need to be tracked consistently.
Funders or government partners need comparable reporting.
Programmes need better evidence for learning, accountability and decision-making.
We help you set up the system and embed it in practice
ImpactBoard comes with implementation support to help organisations configure the platform, migrate data, design dashboards, train users and build reporting routines.
Responsible data management for sensitive social impact data.
ImpactBoard Nexus is designed to help organisations manage sensitive programme, beneficiary and partner data responsibly.
ImpactBoard is hosted on AWS. Data is stored in South Africa. Where approved international services are used, data is encrypted in transit and at rest. Nexus can be configured with role-based access, user permissions, audit trails and data governance settings to support responsible data management.
We design implementations with privacy, regulatory requirements and governance in mind, including POPIA-aligned data management practices.
Dashboards live in ImpactBoard, and the same governed data can feed the business intelligence tools your analysts and stakeholders already use.
Microsoft Power BI
Tableau
Google Data Studio
Ready to strengthen your impact data system?
Whether you are a funder, government partner, NGO, evaluator or multi-partner programme, ImpactBoard Nexus can help you connect frontline data to clearer reporting, learning and decision-making.
ImpactBoard helps organisations move from static strategy documents to live performance dashboards. Set objectives, define measurable key results, track indicators, assign accountability and visualise progress across teams, departments, programmes or partner networks.
Track strategic objectives, key results, owners, targets and progress
Department performance
Cascade goals across teams and business units
Portfolio reporting
Monitor multiple initiatives, programmes or projects in one view
Partner performance
Track supplier, grantee, SME or implementation partner results
Board reporting
Convert strategy progress into executive dashboards
Planning an OKR or performance rollout? Our team configures ImpactBoard Pulse as your branded OKR tracking platform. See Services.
Pricing · ImpactBoard Nexus
Flexible plans for growing organisations.
Choose a plan that fits your team size, reporting needs, and implementation goals. Whether you're just getting started or managing multiple sites, ImpactBoard scales with you.
Standard
R3 750 / month
Great for collecting and visualising data on an ad hoc basis as well as managing data for clearcut projects.
Unlimited usersCustom dashboardsOffline data collectionBeneficiary trackingSecure cloud access
Looking for something else?
Pricing · ImpactBoard Pulse
White-label pricing that scales with your network.
ImpactBoard Pulse is deployed as a white-label platform under your own brand: your logo, your domain, your partner network. Pricing has two components: a monthly platform management fee for your organisation, and a per-organisation subscription for each partner or entity you onboard.
10% off per-organisation fees for 11–20 organisations, 15% for 21–50, and 20% for 50+ (negotiable).
Optional add-ons
API integration support (R8 000 setup + R2 000/month) and once-off historical data migration (from R25 000).
Billing notes
All prices exclude VAT. Annual prepayment qualifies for a 10% discount.
FAQs
Pricing, security & procurement.
The questions we are asked most often, answered in full. If yours is not here, send it to us and we will answer it directly.
What is ImpactBoard?
ImpactBoard is a secure, configurable data management and reporting platform that helps organisations track strategy, performance and impact: from objectives and key results to programme outcomes, partner reporting and executive dashboards.
What is the difference between ImpactBoard Nexus and ImpactBoard Pulse?
Nexus is the social impact and M&E edition for funders, NGOs, foundations, evaluators and government partners. Pulse is the white-label edition for branded performance, OKR and partner reporting platforms under your own brand and domain.
Can ImpactBoard support OKR tracking?
Yes. Set objectives, define measurable key results, assign accountability and track progress on live dashboards, a core use case, especially through Pulse.
Can ImpactBoard be deployed as a white-label platform?
Yes. ImpactBoard Pulse is deployed under your own brand, domain and visual identity, configured to your workflows and reporting rules.
Where is ImpactBoard data stored?
ImpactBoard data is stored in South Africa. Where approved international services are used, data is encrypted in transit and at rest.
Is ImpactBoard hosted on AWS?
Yes. ImpactBoard is hosted on AWS and uses secure cloud infrastructure to support reliable, scalable and protected data management.
Does ImpactBoard support POPIA-aligned data management?
ImpactBoard is designed to support POPIA-aligned data management practices, including role-based access, configurable permissions, audit trails and data retention settings.
Can users collect data offline?
Yes. Field teams can capture data offline and sync it when back online.
Can ImpactBoard integrate with existing systems?
Yes. Consolidate data from spreadsheets and existing systems, use the API for automated submissions, and connect dashboards to Power BI, Tableau and Google Data Studio.
Who is ImpactBoard best suited for?
Results-driven organisations: funders, NGOs, NPOs, foundations, evaluators and government partners (Nexus), and businesses, intermediaries and ecosystem platforms that need a branded reporting portal (Pulse).
ImpactBoard comes with a range of professional services to help your team get started quickly, use the system effectively, and drive adoption internally. Our approach centres on value creation, customer success and benefits realisation, and every engagement is scoped around the results you need to see.
Planning an OKR or performance rollout? We configure ImpactBoard Pulse as your branded OKR tracking platform. Learn more.
Onboarding Services
Onboarding support covers your priority requirements: getting you live on what matters first, realising the benefits early, and transferring enough know-how that your team can configure the platform and run its own analytics.
Bronze
Clear-cut scope
You know what you need to track and the data already exists in a usable form. We configure the essentials, load what you have, and train your team to take it from there.
Silver
Multiple programmes or teams
Several data sources, a results framework to translate, or reporting that spans more than one team. We design the structure with you and hand over configuration know-how as we build.
Gold
Complex or multi-stakeholder
Many stakeholders with different reporting needs, integration with existing systems, or a rollout that has to carry a change process with it. Deeper design work and a longer support runway.
What onboarding covers
Service
Description
Setup & Configuration
Tailored platform setup
Custom Dashboard Design
Built to reflect your brand & goals
Data Integration Planning
Connect existing systems and spreadsheets
Historical Data Capturing
Bulk uploads and structuring
Change Management Planning
Embed data practices in your team culture
Training & Support
Onboarding, training materials
NB: Every engagement is scoped against your context and quoted on that basis. Your support level is agreed up front and can step up as your requirements grow.
Get a Quote
Request a custom quote
Security & Governance
Built with privacy, security and governance in mind.
ImpactBoard is designed to help organisations manage sensitive programme, beneficiary, partner and performance data responsibly.
ImpactBoard is hosted on AWS and uses secure cloud infrastructure to support reliable, scalable and protected data management. ImpactBoard data is stored in South Africa. Where approved international services are used, data is encrypted in transit and at rest.
We design ImpactBoard implementations with privacy, regulations, governance and responsible data use in mind, including POPIA-aligned practices, role-based access, data retention considerations, audit trails and appropriate user permissions.
Security highlights
Hosted on AWS cloud infrastructure
Data stored in South Africa
Encryption in transit and at rest
Role-based user access
Configurable permissions
Audit trails for key platform activity
Data retention and governance settings
Support for POPIA-aligned data management practices
Security and governance documentation available during procurement
ImpactBoard was developed by Data Innovators, an African, Level 1 B-BBEE innovation and data partner that helps organisations turn data, analytics and AI into responsible value and measurable impact. We collaborate with organisations across sectors to build tools that are local, practical, and scalable.
Our Story
From evidence to platform.
Data Innovators began by helping organisations strengthen monitoring, evaluation, analytics and data storytelling. Over time, that work expanded into digital platforms, complex programme delivery and decision systems, and ImpactBoard was born: a configurable data management and performance platform that provides a shared measurement layer from frontline implementation to executive oversight.
Our Purpose
To help organisations push data boundaries to create positive futures.
Our Values
Driven by Impact.
We value all voices
Inclusion improves both the process and the result.
We get it done
We move with pace, discipline and flexibility.
We are curious
We ask better questions, test ideas and keep learning.
We thrive
We create space for growth, contribution and celebration.
We lead with integrity
We act responsibly, steward resources well and speak with courage.
Why Data Innovators
Boardroom to frontline
Clients choose us when they need a partner who can move between the boardroom and the frontline, connect strategy to implementation, and balance technical rigour with practical adoption. We bring an African perspective, multidisciplinary teams and a commitment to creating evidence before making bold claims. Across every engagement, we focus on value creation, benefits realisation and customer success.
We consider privacy, governance, inclusion and risk throughout the solution lifecycle. ImpactBoard is built and implemented with responsible data use in mind: hosted on AWS, with data stored in South Africa, role-based access, audit trails and support for POPIA-aligned data management practices.
Turn messy spreadsheets into trusted, ImpactBoard-ready data.
Upload a spreadsheet, see exactly what is wrong with it, fix the common problems and download a clean file. No sign-up needed to start. When you are ready, carry that same data straight into ImpactBoard.
Structural validation runs in your browser: length and digits, the date segment, the gender sequence, the citizenship digit and the Luhn checksum.
Structural validation only. It does not verify the person against Department of Home Affairs records.
Batch validate up to 25 records as a visitor, or 1 500 per upload once signed in.
No sign-up and no contact form, for visitors and ImpactBoard users alike.
Enter a 13-digit ID number
Try one:
Data assets
Maintained South African reference data
Browse, search and preview every asset before you download. Sample exports are open to everyone; full datasets and recurring updates need one short form.
SA Administrative Geography Hierarchy
Wards, municipalities, districts, provinces and national structures in one hierarchy, with maintained reference fields for consistent roll-up reporting.
Source
Municipal Demarcation Board · Stats SA
Source date
March 2026
ImpactBoard refresh
2 July 2026
Coverage
All 9 provinces · 257 municipalities
Key fields
Code, name, parent code, level, province
Version
v4.2 · data dictionary included
Preview · first rows
Code
Name
Level
Parent
GT
Gauteng
Province
ZA
JHB
City of Johannesburg
Metro
GT
EKU
City of Ekurhuleni
Metro
GT
DC48
West Rand
District
GT
GT481
Mogale City
Local
DC48
Basic Education Institution / School Masterlist
Maintained education hierarchy and school reference data, useful for matching a messy school list to verified institutions before you report on it.
Source
Department of Basic Education
Source date
January 2026
ImpactBoard refresh
18 June 2026
Coverage
Public and registered independent schools
Key fields
EMIS number, name, phase, district, quintile
Version
v3.0 · data dictionary included
Preview · first rows
EMIS
School
Phase
District
700210345
Boitumelo Primary
Primary
Johannesburg East
700214417
Kagiso Secondary
Secondary
Gauteng West
700219902
Nkosi Combined
Combined
Ekurhuleni North
700223118
Rietvlei Primary
Primary
Sedibeng East
700227740
Thuto Ke Lesedi
Secondary
Tshwane South
ART Regimen Reference Library
A maintained mapping of antiretroviral therapy regimens, drug combinations, regimen codes and classification fields aligned to Tier.Net-style HIV programme tracking and reporting.
The same templates ImpactBoard uses internally, managed in the app. Fill one in and your upload maps and validates first time.
Indicator Definition
Indicator name, code, definition, unit, type, frequency, disaggregation and target structure.
Indicator Monitoring Form
Period, actual, target, source of evidence and comment fields for routine reporting.
Case Management Profile
Person, identifiers, contact details, household, referral and case-status fields.
Keep going
Clean data is the start, not the end.
Create a free workspace to save your cleaned dataset, keep your quality score over time, reuse your cleaning rules, and turn the same records into people, institutions, indicators, forms and dashboards.